

Greaves Cotton Limited (Weekly Chart)
Technical Analysis: Greaves Cotton Limited (Weekly Chart)
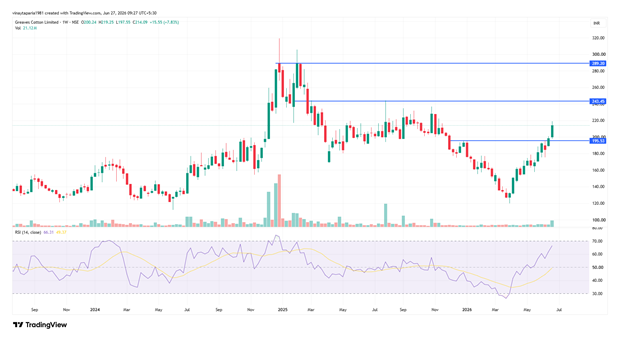
- Current Price and Performance
- Closing Price: ₹214.09
- Weekly Change: +₹15.55 (+7.83%)
- Volume: Strong on the latest candle (21.12M shares)
- 52-Week Range: ₹119.99 – ₹244.30+
- Market Capitalization: ₹4,987 Crore
- Technical Analysis Summary
Price Structure
The stock experienced a strong rally in late 2024 reaching an all-time high near ₹320. It then underwent a sharp correction. In 2026, it found strong support in the ₹130-150 zone and has been recovering steadily. The latest weekly candle is strongly bullish, formed as follow up candle of the break out candle of previous week, closing near the upper end with good volume, indicating renewed buyer interest.
Key Support Levels (from chart):
- Immediate: ₹195.53 – ₹200
- Stronger Support: ₹170 – ₹180
Key Resistance Levels (from chart):
- Near-term: ₹240
- Major Resistance: ₹290 – ₹320 (previous highs) and also target of the breakout
RSI (14-period): 66.31
- Bullish zone but not yet overbought.
- Shows clear recovery from lower levels supporting upward momentum.
- Overall Technical Outlook:
Bullish in the short to medium term. The stock has formed a higher low and is attempting to break out of the recent consolidation. A sustained move above ₹220 would confirm strength toward ₹240 – ₹289 – ₹320 in the coming months. Any dip towards 195-200 level should be used as buying opportunity.
- Risk / Invalidation :
A decisive weekly close below ₹195 (especially with high volume) would turn this into a failed breakout. In that case, expect deeper correction toward ₹175. Risky traders can have a deep stop loss below ₹175 on weekly closing basis
- Bottom Line:
The chart shows a strong bullish structure with a strong follow up weekly candle after break out. The key weekly breakout support at ₹195. As long as this level holds, the bias remains bullish for a move toward higher levels.
- Actionable Levels:
- Buy Zone: ₹195–215 (on dips toward support)
- Stop Loss: Weekly close below ₹195. High Risk trader can have a deep SL at 175 on weekly closing basis.
- Targets: ₹240 – ₹290 – ₹320
Disclosure
- It is not a buying or selling advice. Readers are advised to do their own due diligence and to consult their financial advisers before taking any financial decision based on this blog.
Statutory Disclaimers:
“Investment in securities market are subject to market risks. Read all the related documents carefully before investing.
Registration granted by SEBI and certification from NISM in no way guarantee performance of the intermediary or provide any assurance of returns to investors”
Vinay Kumar Taparia
SEBI Registered Research Analyst
Registration No. INH000018276
BSE Enlistment : 6369

