

Menon Bearings Limited (Weekly Chart)
Technical Analysis: Menon Bearings Limited (Weekly Chart)
Menon Bearings is an auto ancillary company (engine bearings & bushings). It shows decent fundamentals with ROE ~22%, ROCE ~25%, low debt, and healthy promoter holding. Valuations are reasonable and the stock is available at 24 Price to Earnings multiples.
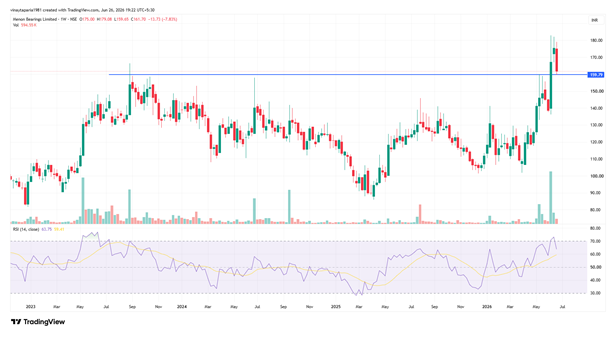
Current Price : ₹161.70 (down ₹13.73 or 7.83% this week)
Key Observations :
- Long-term Trend
The stock has been in a strong secular uptrend since the 2020 lows. It made consistent higher highs and higher lows until 2023, followed by a prolonged consolidation phase (2023–mid 2025) between roughly ₹90–150.
- Major Breakout & Retest (The Most Important Part) :
There is a very prominent horizontal resistance zone (marked by the blue line) around ₹155–160. This level acted as strong resistance for multiple years.
In 2025–early 2026, the stock finally broke out convincingly above this level with strong momentum (multiple green candles). It rallied sharply toward ₹180–182. The latest weekly candle is a large red bearish candle that has pulled the price back sharply to ₹159.65–161.70 — right at the breakout level. This is a classic retest of the broken resistance turned support.
- RSI (14) – Bullish
RSI is in bullish territory (>50) and has been rising along with price during the breakout. It is not overbought (well below 70), so there is still room for upside if support holds.
- Volume
Volume spikes are visible during both the breakout
Support & Resistance (Target) Levels (Weekly)
| Level | Price Zone | Type | Significance |
| Resistance 1 | ₹180–182 | Immediate | Recent swing high |
| Resistance 2 | ₹200 | Next major | New all-time high territory. Phycological level |
| Resistance 3 | ₹240-₹245 | Final | Multi Year breakout target |
| Support 1
(Critical) |
₹155–160 | Key Retest | Broken resistance, now support |
| Support 2 | ₹140–145 | Strong | Previous consolidation zone |
| Support 3 | ₹120–130 | Major | Strong historical support |
Trading / Investment View
Bullish Bias (as long as support holds) .
A successful retest of the ₹155–160 zone on the weekly timeframe is good entry point. If the stock holds above ₹155–160 and starts forming higher lows, the next leg up toward ₹180 – ₹200- ₹240 becomes highly probable.
Risk / Invalidation :
A decisive weekly close below ₹155 (especially with high volume) would turn this into a failed breakout. In that case, expect deeper correction toward ₹140–145.
Summary
| Aspect | View | Comment |
| Trend | Bullish | Long-term uptrend intact |
| Breakout | Valid | Strong move above multi-year resistance |
| Current Action | Retest | Healthy pullback to breakout support |
| RSI | Bullish | Room to run |
| Risk-Reward | Favourable | Good setup near support with defined risk |
Bottom Line:
The chart shows a strong bullish structure with a healthy retest of the key weekly breakout support at ₹155–160. As long as this level holds, the bias remains bullish for a move toward new highs.
Actionable Levels:
- Buy Zone: ₹155–162 (on dips toward support)
- Stop Loss: Weekly close below ₹154–155. High Risk trader can have a deep SL at 140 on weekly closing basis.
- Targets: ₹180 – ₹200- ₹240
Disclosure
- It is not a buying or selling advice. Readers are advised to do their own due diligence and to consult their financial advisers before taking any financial decision based on this blog.
- Research analyst or his associates or his relatives have no financial interest in the subject company.
- Research analyst or his associates or relatives, have no actual/beneficial ownership of one per cent or more securities of the subject company, at the end of the month immediately preceding the date of publication of the research report or date of the public appearance or research recommendation
- Research analyst or his associate or relatives has no connection or association of any sort with any issuer of products/ securities recommended herein.
- Research analyst or his associate or his relative has no actual or potential conflicts of interest arising from any connection to or association with any issuer of products/ securities, including any material information or facts that might compromise his objectivity or independence in the carrying on of research and recommendations services.
- Research analyst or his associates has not received any kind of remuneration or consideration form the products/ securities recommended herein.
- Research analyst or his associates have not received any compensation from the subject company in past 12 months.
- Research analyst or his associates have not managed or co-managed the public offering of Subject Company in past 12 months.
- Research analyst or his associates have not received any compensation for investment banking or merchant banking of brokerage services from the subject company in past 12 months.
- Research analyst or his associates have received any compensation for products or services other than investment banking or merchant banking or brokerage services from the subject company in the past twelve month
- Research analyst or his associates have not received any compensation or other benefhis from the subject company or third party in connection with the research report or research recommendations.
- Research analyst or his associates have not received any compensation for products or services from the subject company in past 12 months.
- The subject company is or was not a client of Research analyst or his associates during twelve months preceding the date of distribution of the research report and recommendation services provided.
- Research Analysts or his associates has not served as an officer, director or employee of the subject company.
- Research Analysts has not been engaged in market making activity of the subject company
Vinay Kumar Taparia
SEBI Registered Research Analyst
Registration No. INH000018276
BSE Enlistment : 6369
Statutory Disclaimers:
“Investment in securities market are subject to market risks. Read all the related documents carefully before investing.
Registration granted by SEBI and certification from NISM in no way guarantee performance of the intermediary or provide any assurance of returns to investors”

